


For long, debates among economists and social scientists on the impact of population change on economic development centered on positions that population growth either restricts, promotes, or is independent of economic development. Despite the merits of these views, a critical issue is largely ignored which is the age structure of the population that can change dramatically as the population grows. As people’s economic behaviour varies at different stages of life, changes in a country’s age structure can have substantial effects on its economic performance. This latter view relates to a ‘demographic dividend’ which can exert a large positive effect on the economy stemming from a favourable age structure of the country.
The demographic dividend is not, however, automatic. With the right kind of policy environment, this demographic dividend can attain the targeted objectives. This brings to the fundamental question: how do some countries make the most of the demographic dividend and why others don’t?
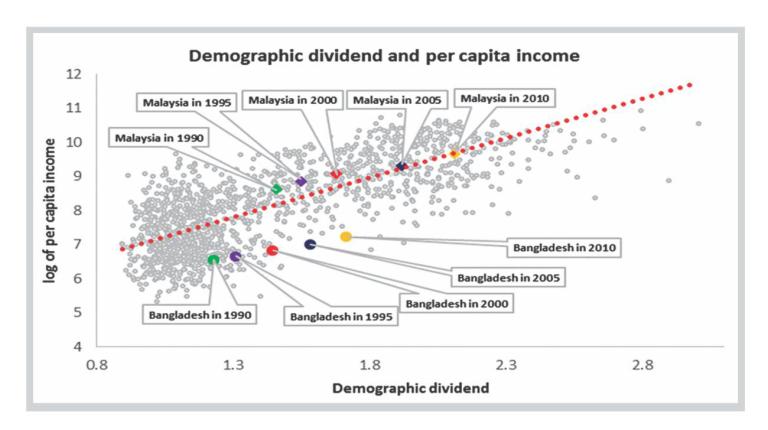
A simple association between the demographic dividend and per capita income, as is shown in the scatter-plot, can shed some light on this issue. The scatter-plot is generated with the data of 124 countries for the period between 1950 and 2010 with five-year intervals. The demographic dividend is calculated from the data of the United Nations (Department of Economic and Social Affairs-Population Division) and is defined as the ratio of the working-age population to the dependent population. The per capita income data are from the World Bank WDI. Since the demographic dividend might have a lag effect on per capita income change, we assume that the data of the demographic dividend for any particular year corresponds to the average per capita income data for the subsequent five years. For example, demographic dividend data for 1950 corresponds to the average of per capita income data for 1951-1955. The trend line (red-dotted) shows a very strong positive association between the demographic dividend and per capita income. Though simple, even this scatter-plot tells us a very interesting story. If we compare an East Asian country (Malaysia) with a South Asian country (Bangladesh) we find that both Malaysia and Bangladesh, during 1990 and 2010, were experiencing rising demographic dividends which contributed to the rise in their per capita incomes. However, Bangladesh has always been much below the trend line, whereas Malaysia was always on or above the trend line. This suggests that compared to Bangladesh, Malaysia was much better able to utilise its demographic dividend to raise its per capita income during the period under consideration. For Bangladesh, the concern is that the country is yet to exploit the demographic dividend it has, and over time, the distance from the trend line has enlarged. Interestingly, in 2010, Bangladesh had a demographic dividend similar to the one Malaysia had in 2000, but Bangladesh in 2010 had one-seventh of the per capita income of what Malaysia had in 2000.
The aforementioned analysis is also supported by results from a cross-country least square dummy variable (LSDV) panel regression of 124 countries for the period between 1950 and 2010 with data of five-year intervals. Here the dependent variable is the log of per capita income. The explanatory variables are the log of demographic dividend (as defined earlier) and two interaction variables – The first one is the interaction between log of demographic dividend and South Asia dummy and the second one is the interaction between log of demographic dividend and East Asia dummy. We also add a few other control variables such as fixed capital formation as a percent of GDP, government consumption as percent of GDP, trade-GDP ratio, under-five mortality rate and manufacturing export as a percent of total export. As we did in the scatter-plot exercise, here we also assume that the data of the demographic dividend for any particular year corresponds to the respective averages of all other variables of the subsequent five years. The LSDV panel regression results suggest that all control variables have expected and significant signs: the ratio of fixed capital formation to GDP, the ratio of government consumption to GDP, the trade-GDP ratio and manufacturing export to total export ratio have positive and significant signs, and the under-five mortality rate has a negative and significant sign. The demographic dividend variable has a positive and significant sign and the size of the coefficient suggests that a 1 percent increase in the demographic dividend leads to a 0.24 percent increase in the per capita income. Both South Asia and East Asia interaction dummies are positive and significant with coefficients 0.87 and 1.71 respectively, suggesting that these two regions have larger positive effects of demographic dividends on the rise in their per capita incomes than the global average. However, the effect is double for East Asia compared to that for South Asia.
How did the East Asian countries make the best use of the demographic dividend? Evidence suggests that compared to the South Asian countries, most of the East Asian countries were in a better position to successfully capitalise on shifts in their age structures to gain a boost in economic productivity. The critical policy areas that made the difference included investment in youth development, expanding access to family planning, investment in infrastructure, public health, education, especially female education and skill development. Also, decisive policy emphasis was on promoting both labour-intensive and skill-intensive jobs, savings and openness to trade and foreign investment.


